At VIPR, we provide data management for insurance program MGA/MGU business and other delegated program related administration, constantly monitoring all phases of program business operations to identify the most effective ways to develop and implement profitable programs.
In a previous VIPR posting, leading actuary Jessica Leong identified seven key principles for organising and presenting data, known as “data visualisation” to achieve program business goals.
In this post, former insurance and program business executive Greg Massey, now VIPR’s North American Advisor, reacts to Leong’s observations with his own perspectives on what insurers, reinsurers and fronting carriers are looking for when it comes to data provided by program administrators and MGAs.
‘Tenacity’ needed
According to Massey, the “tenacity” with which program managers apply Leong’s principles will allow them to maintain real control of a portfolio, as opposed to having its performance subject to factors outside their control.
Fundamentally, “portfolios are competing for capital,” Massey says. “Capital providers have options as to where to place their money. If a program portfolio does not provide a favorable return or an outlook for favorable returns, it will lose access to that capital. It’ll have to exit the business or shop for an alternative source of capital.”
From the outset of a program, says Massey, fronting carriers and insurers/reinsurers will want to see timely, thorough data on the type of risks being brought into a portfolio.
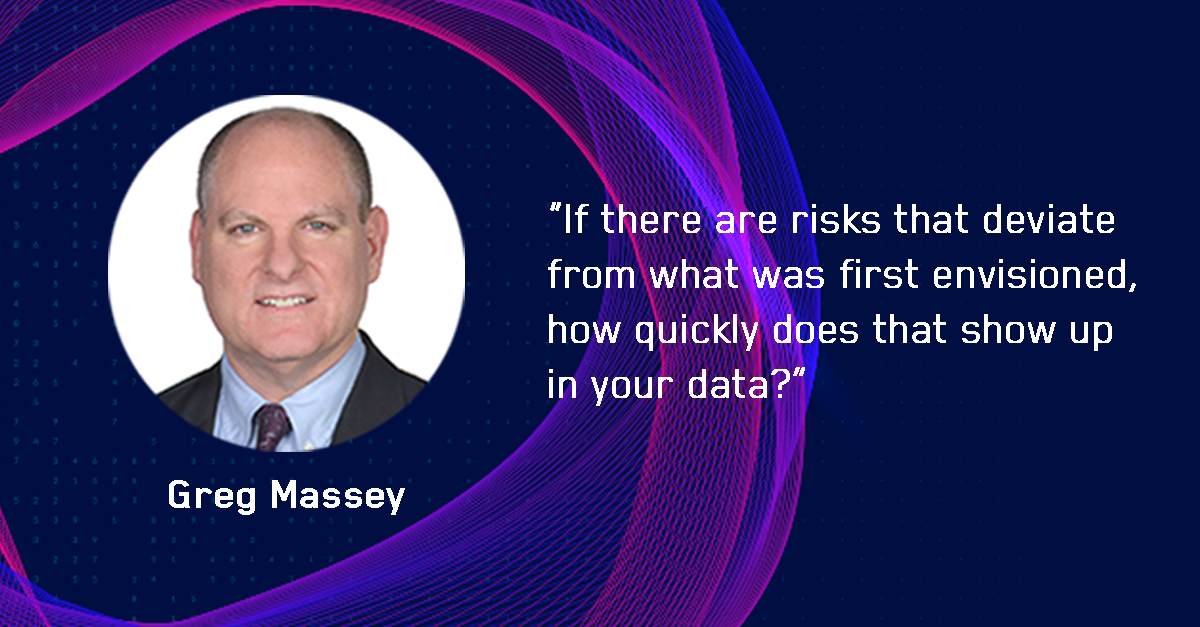
“Are you actually writing the type of business you said you were targeting?” he asks. “If there are risks that deviate from what was first envisioned, how quickly does that show up in your data? What procedures are in place to notify your program partners, take corrective action, and/or modify your underwriting strategy, if needed?”
Data discussions
Directly related to exposure data is data cited by Leong on how accounts are acquired and the aggregation of insured property and liability risks.
“Data on distribution is really key at the outset of a program,” Massey says. “Early on, the carrier will receive a lot of anecdotal feedback concerning the market’s response to a program. It is important to be able to validate that feedback with actual data on what’s in the pipeline.”
Timely, accurate data on risk aggregations can be a matter of life or death for a program, Massey adds.
“One or two loss events can put an end to a program,” he says, “but it doesn’t necessarily have to be that way. Being transparent with your carrier partner allows both parties to manage exposure to large loss events proactively and minimize the chances for a big surprise.”
If you are shopping for a new carrier for an existing program, understand that risk-bearing entities will want to see comprehensive, well-structured data on the frequency and severity as related to attritional, large and catastrophic losses for each coverage provided.
This data will certainly be subjected to statistical analysis, says Massey, but don’t overlook the need to discuss it with program partners and insureds.
“It’s critically important to meet with carriers and claims administrators to talk through the results, analyse the trends, and use the information to influence the next steps,” he says. ”It’s equally important to share claims information with customers in a way that resonates with them.”
Pricing determinations
The principal payoff for all this effort to gather and report sound data is to provide the foundation for competitive but profitable pricing. The key to sustained success, according to Massey, is the ability to establish risk-based pricing based on unique characteristics of accounts, constrained as little as possible by competitor rates.
“Anyone can write a risk by charging less,” he says. “You want risk quality to drive your pricing decisions more than market forces.
“Sound data management, combined with modern data science, will help you transcend traditional or legacy views of what makes for a good risk, allowing you to discriminate fairly in determining which risks deserve favorable pricing.”
A program portfolio based on adherence to sound data visualisation practices should streamline policy renewals with no loss of underwriting integrity, Massey adds. “It helps drive costs out of the system and allows MGAs to focus on portfolio growth with new business.”
KPIs: Too much is too much
It’s important to remember that Greg Massey came to VIPR as an insurance business leader, not as a promoter of data.
For all his emphasis on the importance of reporting comprehensive data, Massey cautions program participants from establishing too many data-based “key performance indicators” (KPIs).
“The key is to have a manageable set of KPIs,” he says. “Too often there’s an abundance of KPIs that a portfolio team needs to follow. This becomes burdensome and, at time, conflicting. Limit your KPIs to main drivers of portfolio performance that you can act upon for impactful and desired results.”
If you would like more information on VIPRs Data Analytics technology, helping underwriters and risk professionals make better decisions to improve the overall portfolio performance, CONTACT US and we'd be happy to show you demo and it's capabilities.
